Log based alerts
A Log-based alert allows you to define conditions based on log data, triggering alerts when these conditions are met. Here's a breakdown of the various sections and options available when configuring a Log-based alert:
Step 1: Define the Log Metric
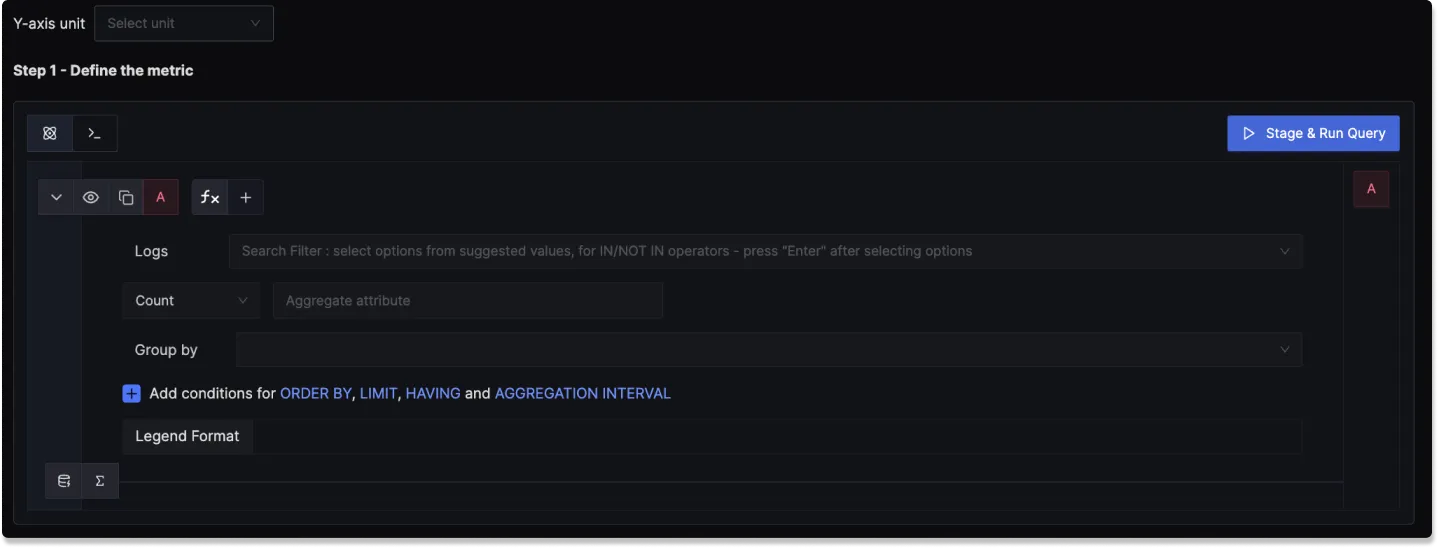
In this step, you use the Logs Query Builder to apply filters and operations on your logs to define conditions which triggers log based alert Some of the fields that are available in Logs Query Builder includes:
Logs: A field to filter the specific log data to monitor.
Aggregate Attribute: Allows you to select how the log data should be aggregated (e.g., "Count").
Group by: Provides options to group log data by various attributes, such as "service.name", "method" or custom attributes.
Legend Format: Lets you define the format for the legend in the visual representation of the alert.
Having: Apply conditions to filter the results further based on aggregate value.
Step 2: Define Alert Conditions
In this step, you define the specific conditions for triggering the alert, as well as the frequency of checking those conditions:
Send a notification when [A] is [above/below] the threshold [in total] during the last [X mins]: A template to set the threshold and define when the alert condition should be checked.
Alert Threshold: A field to specify the threshold value for the alert condition.
More Options :
Run alert every [X mins]: This option determines the frequency at which the alert condition is checked and notifications are sent.
Send a notification if data is missing for [X] mins: A field to specify if a notification should be sent when data is missing for a certain period.

Step 3: Alert Configuration
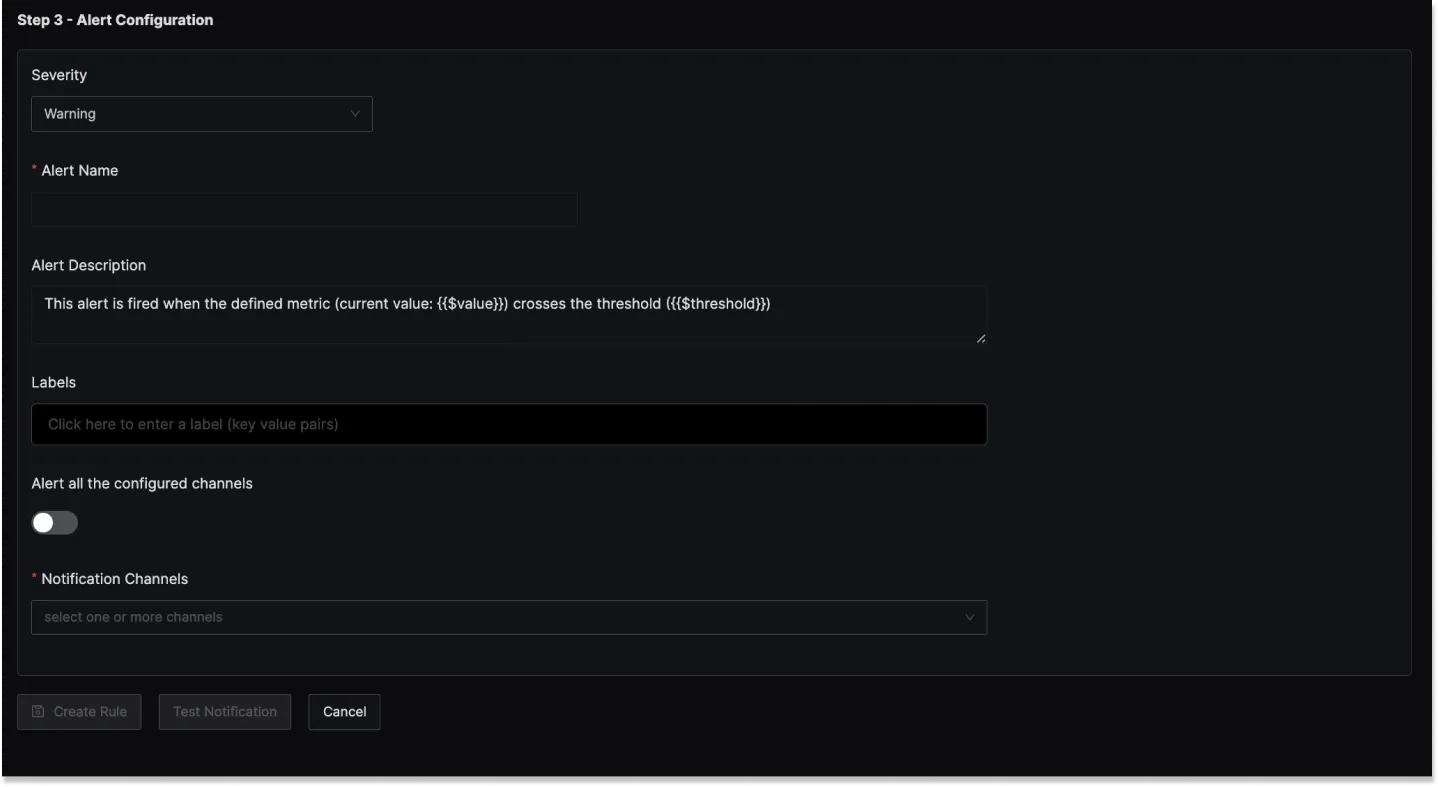
In this step, you set the alert's metadata, including severity, name, and description:
Severity
Set the severity level for the alert (e.g., "Warning" or "Critical").
Alert Name
A field to name the alert for easy identification.
Alert Description
Add a detailed description for the alert, explaining its purpose and trigger conditions.
You can incorporate result attributes in the alert descriptions to make the alerts more informative:
Syntax: Use $<attribute-name> to insert attribute values. Attribute values can be any attribute used in group by.
Example: If you have a query that has the attribute service.name in the group by clause then to use it in the alert description, you will use $service.name.
Slack alert format
Using advanced slack formatting is supported if you are using Slack as a notification channel.
Labels
A field to add static labels or tags for categorization. Labels should be added in key value pairs. First enter key (avoid space in key) and set value.
Notification channels
A field to choose the notification channels from those configured in the Alert Channel settings.
Test Notification
A button to test the alert to ensure that it works as expected.
Examples
1. Alert when percentage of redis timeout error logs greater than 7% in last 5 mins
Here's a video tutorial for creating this alert:
Step 1: Write Query Builder query to define alert metric
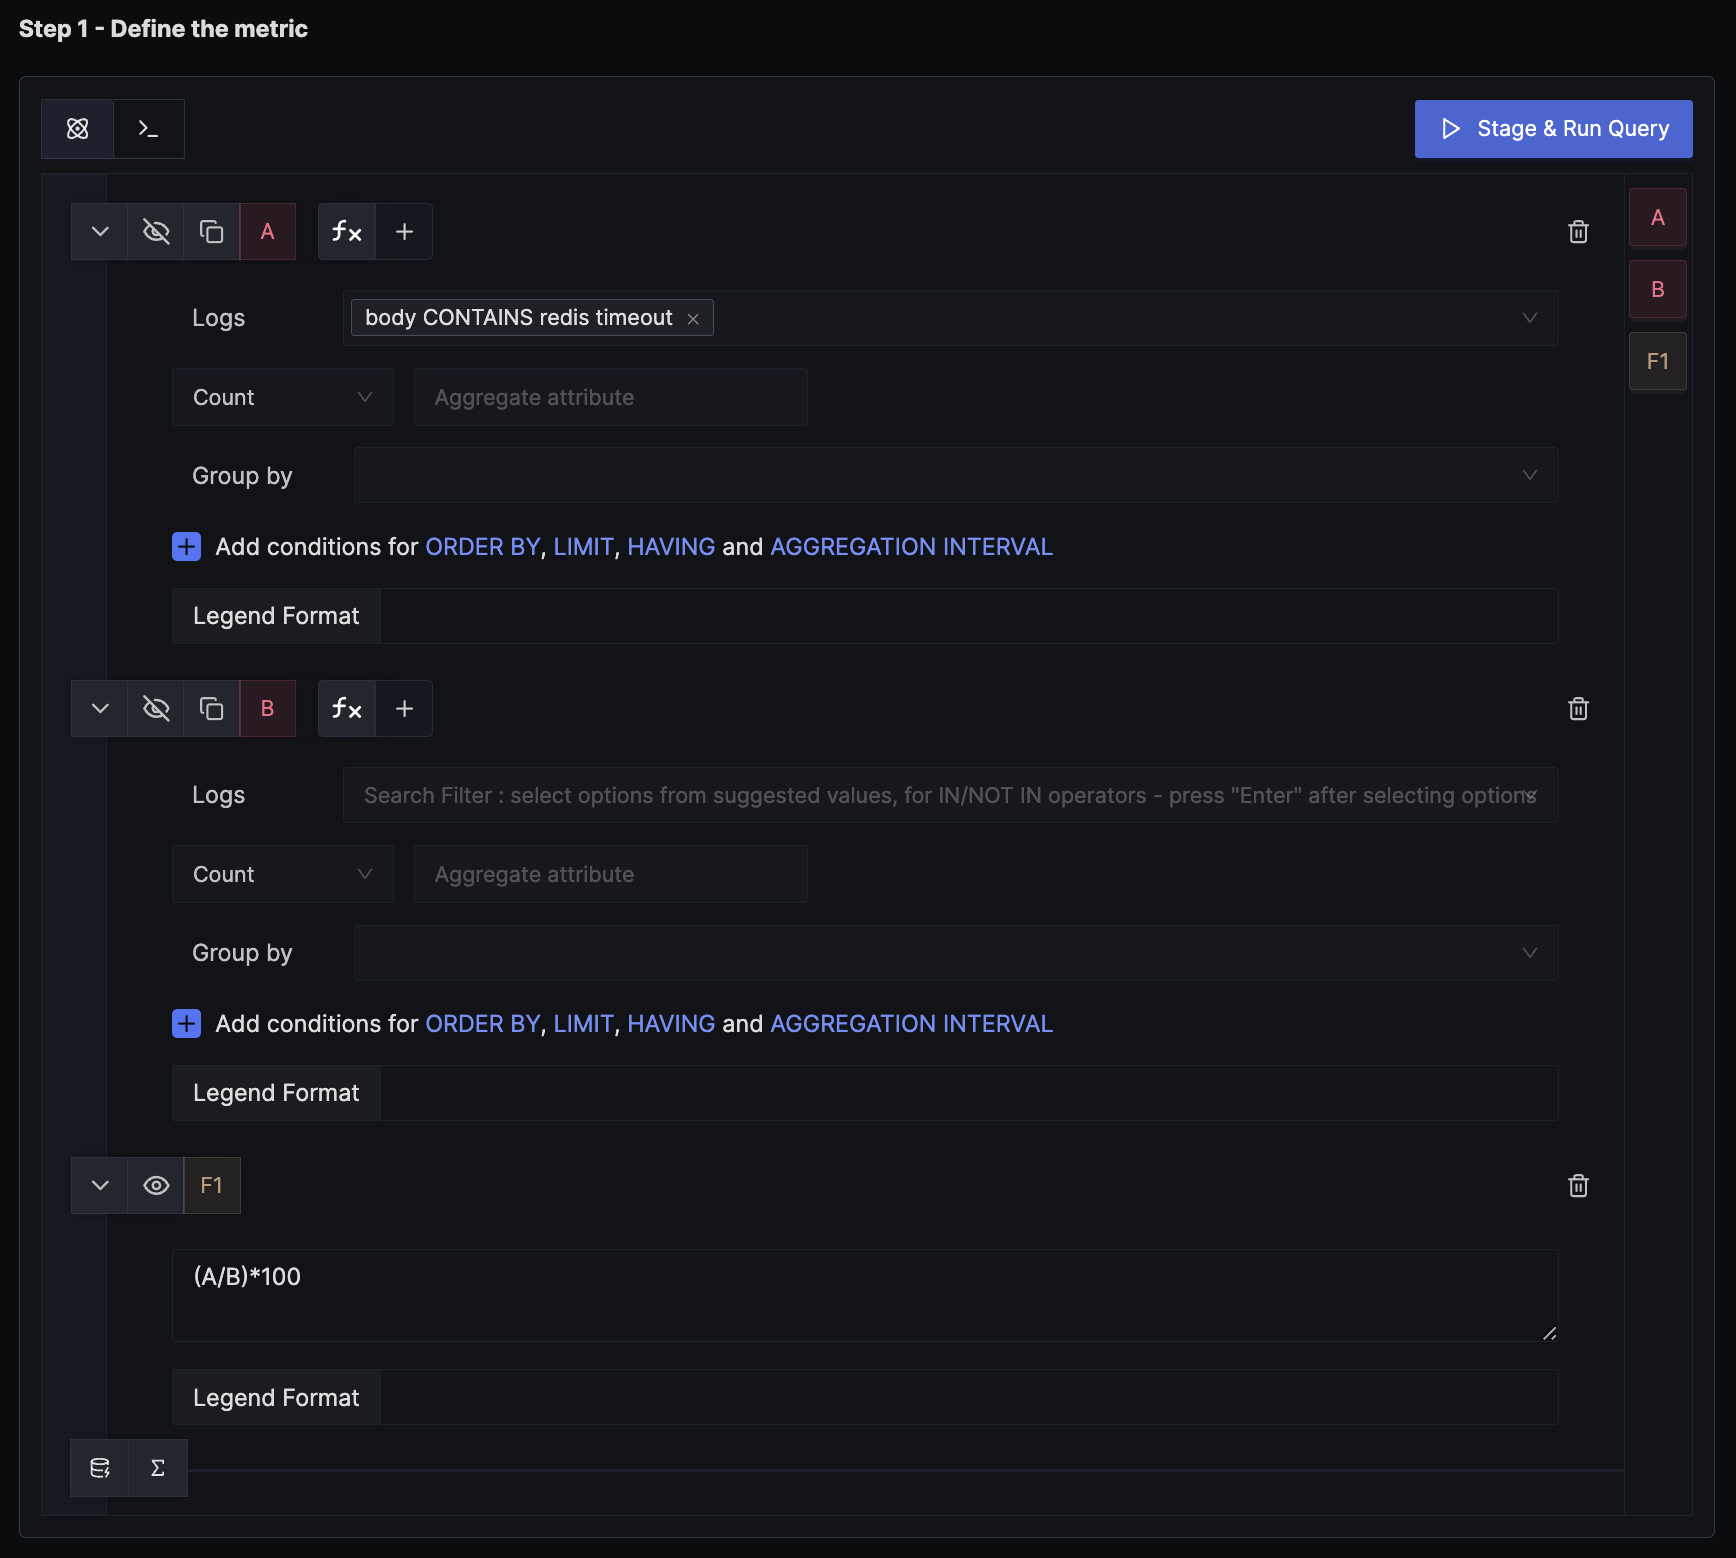
Here we write 2 queries to calculate error logs percent. First query to count logs which are redis timeout error logs. Second query to count total logs. Then we add a formula to calculate percentage.
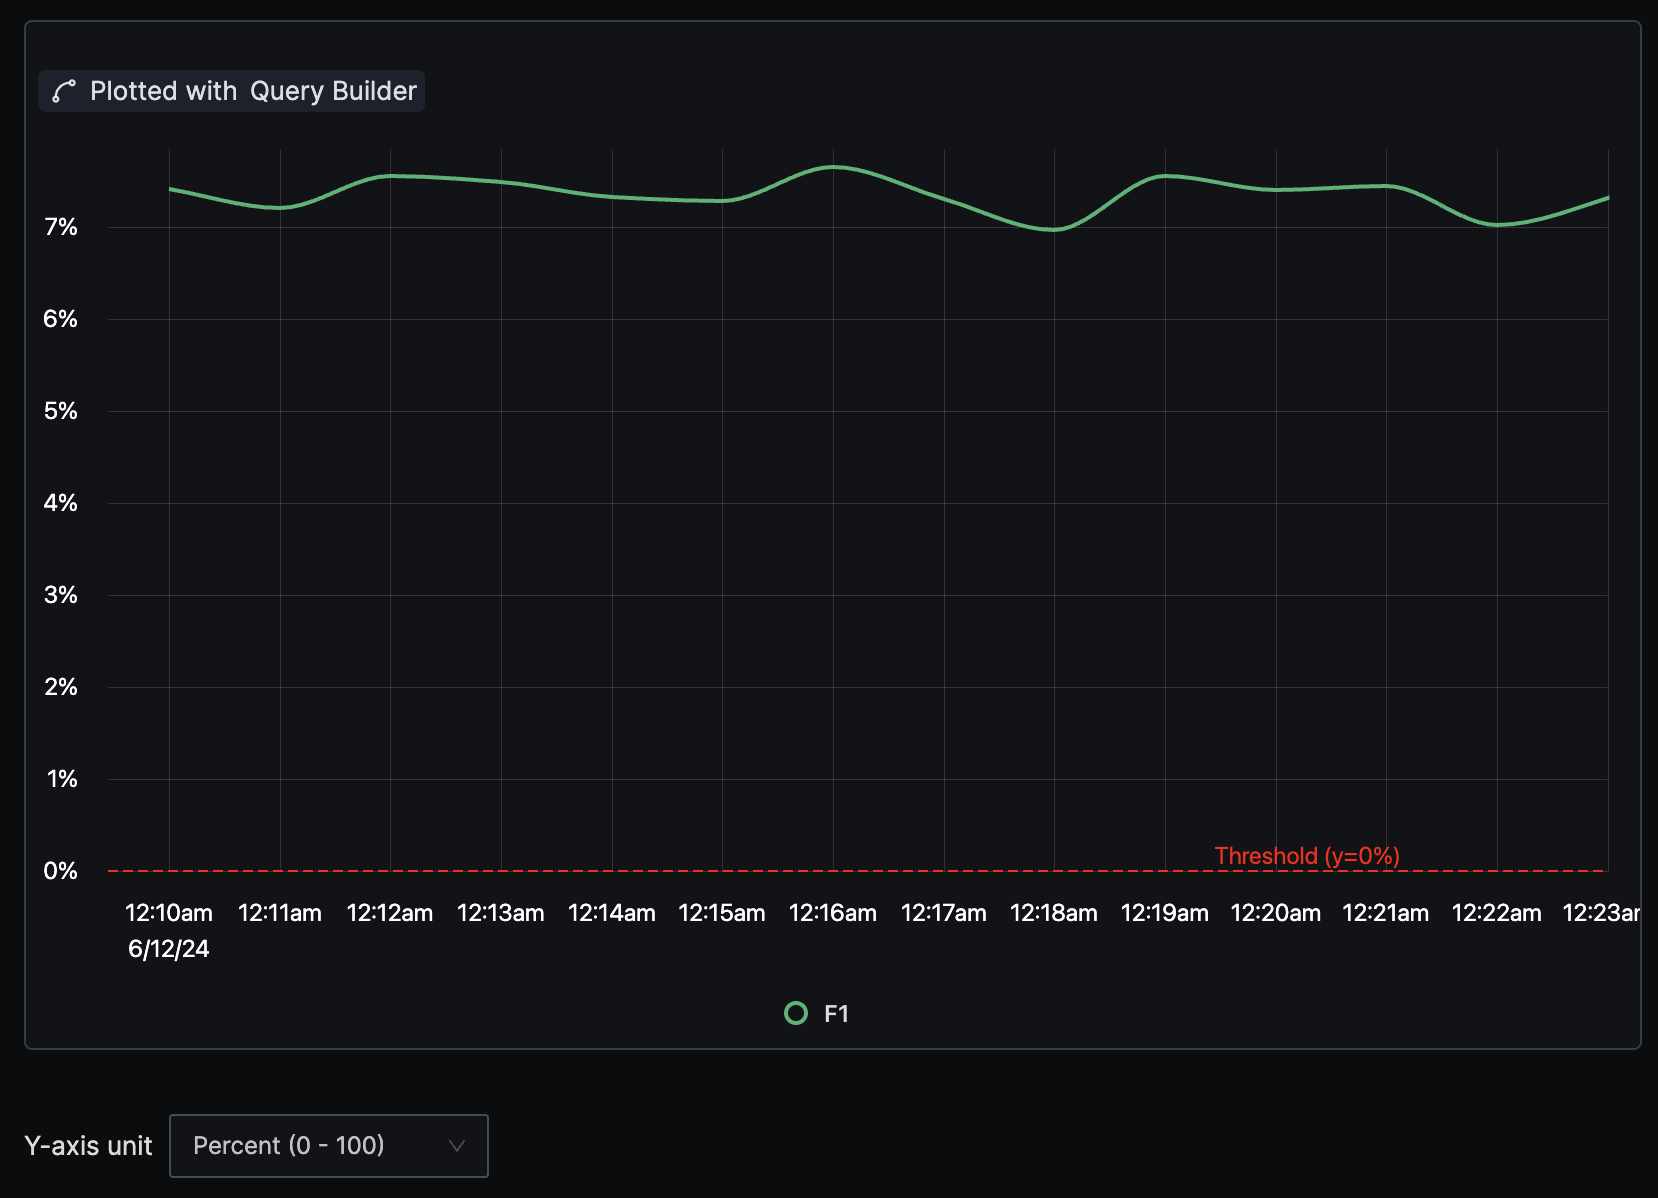
Remember to select y-axis unit as Percent(0-100) as we want to apply threshold in percent.
Step 2: Set alert conditions

The condition is set to trigger a notification if the per-minute error logs percentage exceeds the threshold of 1 second on average in the last five minutes.
Step 3: Set alert configuration
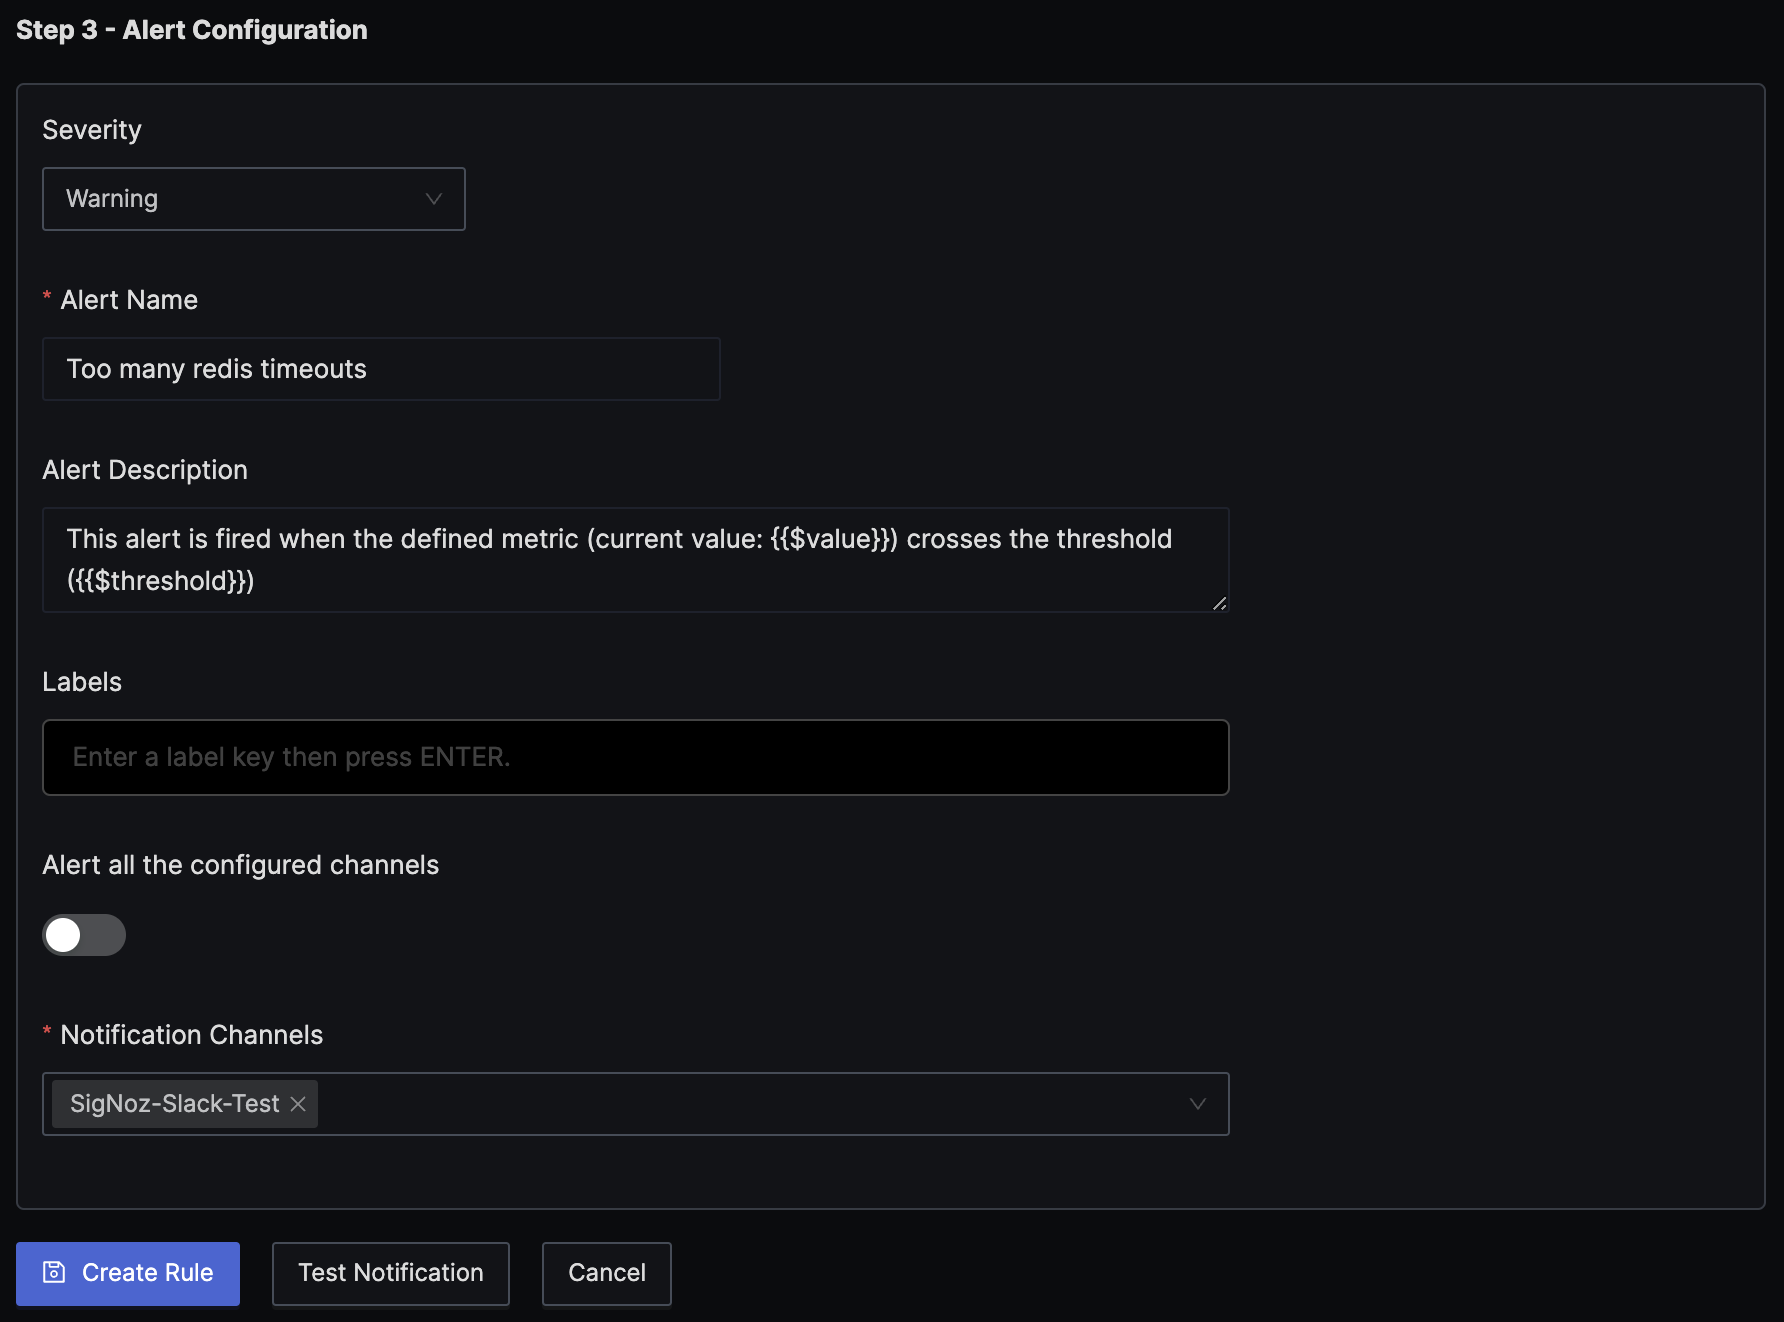
At last configure the alert as Warning, add a name and notification channel.
